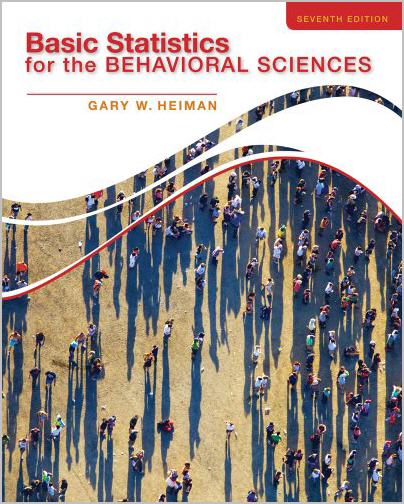
Basic Statistics for the Behavioral Sciences 7th Edition by Gary Heiman, ISBN-13: 978-1133956525
[PDF eBook eTextbook]
- Publisher: Cengage Learning; 7th edition (January 1, 2013)
- Language: English
- 504 pages
- ISBN-10: 1133956521
- ISBN-13: 978-1133956525
Packed with real-world illustrations and the latest data available, BASIC STATISTICS FOR THE BEHAVIORAL SCIENCES, 7e demystifies and fully explains statistics in a lively, reader-friendly format. The author’s clear, patiently crafted explanations with an occasional touch of humor, teach readers not only how to compute an answer but also why they should perform the procedure or what their answer reveals about the data. Offering a conceptual-intuitive approach, this popular book presents statistics within an understandable research context, deals directly and positively with potential weaknesses in mathematics, and introduces new terms and concepts in an integrated way.
Table of Contents:
IFC1
IFC2
IFC3
IFC4
Half Title
Title
Statement
Copyright
Dedication
Brief Contents
Contents
Preface to the Instructor
Ch 1: Introduction to Statistics
Getting Started
Introduction
Why is it Important to Learn Statistics (and how do I do that?)
Review of Mathematics Used in Statistics
Putting it all Together
Chapter Summary
Key Terms
Review Questions
Application Questions
Ch 2: Statistics and the Research Process
Getting Started
Introduction
The Logic of Research
Applying Descriptive and Inferential Statistics
Understanding Experiments and Correlational Studies
The Characteristics of Scores
Statistics in Published Research: Using Statistical Terms
Putting it all Together
Chapter Summary
Key Terms
Review Questions
Application Questions
Ch 3: Frequency Distributions and Percentiles
Getting Started
Introduction
New Statistical Notation
Why is it Important to know about Frequency Distributions?
Simple Frequency Distributions
Types of Simple Frequency Distributions
Relative Frequency and the Normal Curve
Computing Cumulative Frequency and Percentile
Statistics in Published Research: Apa Publication Rules
A Word about Grouped Frequency Distributions
Putting it all Together
Chapter Summary
Key Terms
Review Questions
Application Questions
Integration Questions
Summary of Formulas
Ch 4: Measures of Central Tendency: The Mean, Median, and Mode
Getting Started
Introduction
New Statistical Notation
Why is it Important to know about Central Tendency
What is Central Tendency
The Mode
The Median
Transformations and the Mean
Deviations around the Mean
Describing the Population Mean
Summarizing Research
Statistics in Published Research: Using the Mean
Putting it all Together
Chapter Summary
Key Terms
Review Questions
Application Questions
Integration Questions
Summary of Formulas
Ch 5: Measures of Variability: Range, Variance, and Standard Deviation
Getting Started
Introduction
New Statistical Notation
Why is it Important to know about Measures of Variability?
Understanding the Variance and Standard Deviation
The Population Variance and the Population Standard Deviation
A Summary of the Variance and Standard Deviation
Computing Formulas for the Variance and Standard Deviation
Applying the Variance and Standard Deviation to Research
Statistics in Published Research: Reporting Variability
Putting it all Together
Chapter Summary
Key Terms
Review Questions
Application Questions
Integration Questions
Summary of Formulas
Ch 6: z-Scores and the Normal Curve
Getting Started
Introduction
New Statistical Notation
Why is it Important to know about z-Scores?
Understanding z-Scores
Interpreting z-Scores Using the z-Distribution
Using z-Scores to Compare Different Variables
Using z-Scores to Determine the Relative Frequency of Raw Scores
Statistics in Published Research: Using z-Scores
Using z-Scores to Describe Sample Means
Putting it all Together
Chapter Summary
Key Terms
Review Questions
Application Questions
Integration Questions
Summary of Formulas
Ch 7: The Correlation Coefficient
Getting Started
Introduction
New Statistical Notation
Why is it Important to know about Correlation Coefficients?
Understanding Correlational Research
Types of Relationships
Strength of the Relationship
The Pearson Correlation Coefficient
The Spearman Rank-Order Correlation Coefficient
The Restriction of Range Problem
Statistics in Published Research: Correlation Coefficients
Putting it all Together
Chapter Summary
Key Terms
Review Questions
Application Questions
Integration Questions
Summary of Formulas
Ch 8: Linear Regression
Getting Started
Introduction
New Statistical Notation
Why is it Important to know about Linear Regression?
Understanding Linear Regression
The Linear Regression Equation
The Standard Error of the Estimate
Computing the Proportion of Variance Accounted for
A Word About Multiple Correlation and Regression
Statistics in Published Research: Linear Regression
Putting it all Together
Chapter Summary
Key Terms
Review Questions
Application Questions
Integration Questions
Summary of Formulas
Halfway Review
Introduction
Ch 9: Using Probability to Make Decisions about Data
Getting Started
Introduction
New Statistical Notation
Why is it Important to know about Probability?
The Logic of Probability
Computing Probability
Obtaining Probability from the Standard Normal Curve
Random Sampling and Sampling Error
Deciding Whether a Sample Represents a Population
Putting it all Together
Chapter Summary
Key Terms
Review Questions
Application Questions
Integration Questions
Summary of Formulas
Ch 10: Introduction to Hypothesis Testing
Getting Started
Introduction
New Statistical Notation
Why is it Important to know about the z-Test?
The Role of Inferential Statistics in Research
Setting Up Inferential Procedures
Performing the z-Test
Interpreting Significant Results
Interpreting Nonsignificant Results
Summary of the z-Test
The One-Tailed Test
Errors in Statistical Decision Making
Statistics in Published Research: Reporting Significance Tests
Putting it all Together
Chapter Summary
Key Terms
Review Questions
Application Questions
Integration Questions
Summary of Formulas
Ch 11: Performing the One-Sample t-Test and Testing Correlation Coefficients
Getting Started
Introduction
Why is it Important to know about t-Tests?
Performing the One-Sample t-Test
Estimating µ by Computing a Confidence Interval
Statistics in Published Research: Reporting the t-Test
Significance Tests for Correlation Coefficients
Maximizing the Power of Statistical Tests
Putting it all Together
Chapter Summary
Key Terms
Review Questions
Application Questions
Integration Questions
Summary of Formulas
Ch 12: The Two-Sample t-Test
Getting Started
Introduction
New Statistical Notation
Why is it Important to know about the two-Sample t-Test?
Understanding the Two-Sample t-Test
The Independent-Samples t-Test
Summary of the Independent-Samples t-Test
The Related-Samples t-Test
Statistical Hypotheses for the Related-Samples t-Test
Summary of the Related-Samples t-Test
Describing the Relationship in a Two-Sample Experiment
Statistics in Published Research: The Two-Sample Experiment
Putting it all Together
Chapter Summary
Key Terms
Review Questions
Application Questions
Integration Questions
Summary of Formulas
Ch 13: The One-Way Analysis of Variance
Getting Started
Introduction
New Statistical Notation
Why is it Important to know about ANOVA?
An Overview of ANOVA
Understanding the ANOVA
Performing the ANOVA
Performing Post HOC Comparisons
Summary of Steps in Performing a One-Way ANOVA
Additional Procedures in the One-Way ANOVA
Statistics in Published Research: Reporting ANOVA
Putting it all Together
Chapter Summary
Key Terms
Review Questions
Application Questions
Integration Questions
Summary of Formulas
Ch 14: The Two-Way Analysis of Variance
Getting Started
Introduction
New Statistical Notation
Why is it Important to know about the Two-Way ANOVA?
Understanding the Two-Way Design
Overview of the Two-Way, Between-Subjects ANOVA
Computing the Two-Way ANOVA
Completing the Two-Way Experiment
Summary of the Steps in Performing a Two-Way ANOVA
Putting it All Together
Chapter Summary
Key Terms
Review Questions
Application Questions
Integration Questions
Summary of Formulas
Ch 15: Chi Square and Other Nonparametric Procedures
Getting Started
Introduction
Why is it Important to know about Nonparametric Procedures?
Chi Square Procedures
One-Way Chi Square
The Two-Way Chi Square
Statistics in Published Research: Reporting Chi Square
Nonparametric Procedures for Ranked Data
Putting it all Together
Chapter Summary
Key Terms
Review Questions
Application Questions
Integration Questions
Summary of Formulas
Second-Half Review
Introduction
A: Additional Statistical Formulas
B: Using SPSS
C: Statistical Tables
D: Answers to Odd-Numbered Questions
Glossary
Index
IBC1
IBC2
IBC3
IBC4
IBC5
IBC6
Gary Heiman is a professor at Buffalo State College. Praised by reviewers and adopters for his readable prose and effective pedagogical skills, he has written four books for Houghton Mifflin (now Cengage Learning): STATISTICS FOR THE BEHAVIORAL SCIENCES, RESEARCH METHODS IN PSYCHOLOGY, UNDERSTANDING RESEARCH METHODS AND STATISTICS, AND ESSENTIAL STATISTICS FOR THE BEHAVIORAL SCIENCES. He received his Ph.D. in cognitive psychology from Bowling Green State University.
What makes us different?
• Instant Download
• Always Competitive Pricing
• 100% Privacy
• FREE Sample Available
• 24-7 LIVE Customer Support


Reviews
There are no reviews yet.